How to make debugging a breeze... or at least a bit easier
Every developer has had occasion to debug a problem happening in the production environment. Our applications produce lots (and I mean LOTS) of lines of logs to help us deal with such problems, however, browsing through plain text log lines, even with full-text search tools, can be cumbersome.
This problem is amplified since multiple instances of the application, processing multiple requests at a time, may be sending logs to a single destination for processing. Different parts of the applications might also have different log formats (i.e. Sidekiq and Rails), adding even more complexity.
That's where the idea of structured logging comes into the picture. It boils down to one thing: What if every line logged by our application was a JSON document? Every line would have a structure to it. It could contain additional data that would allow us to filter the logs easily. We could track the logs across the single request, or group them by the users performing the action.
It seemed like a good idea to at least experiment with, so we rolled up our sleeves and got to work.
Setting up the logger context
The first thing we wanted to tackle was to have a current context for the logger, which could be logged additionally with every line. For this, we found a very useful class from rails, called: ActiveSupport::CurrentAttributes.
It provided a thread-isolated attribute singleton that reset between each request (you can read more about it in the official documentation). We added Current class, with a method to generate data for the logger:
    class Current < ActiveSupport::CurrentAttributes
  attribute :user
  attribute :request_id

  class << self
    def context_for_logger
      result = {
        request_id: request_id,
      }

      if user
        result = result.merge(
          user_id: user.id,
          user_role: user.main_role
        )
      end

      result.compact
    end
  end
end
Then we added a small method to our ApplicationController to initialize the context on each request:
     class ApplicationController < ActionController::Base
  before_action :set_current_context

  [...]

  def set_current_context
    Current.user = current_user
    Current.request_id = request.request_id
  end
end
That method handled context during the request; however, there was still more to solve.
Sometimes user requests might trigger background jobs, handled in a separate process, which should still be logged in the context of the user and request. Therefore, we needed to find a way to initialize the logger context inside the background job.
To do this, first, we added a method that allowed us to recreate Current state from the logger context:
    class Current < ActiveSupport::CurrentAttributes
  [...]

  class << self
    [...]

    def restore_from_logger_context(logger_context)
      if logger_context
        self.request_id = logger_context[:request_id]
        if logger_context[:user_id]
          self.user = User.find(logger_context[:user_id])
        end
      else
        self.request_id = nil
        self.user = nil
      end
    end
  end
end
Then, we needed to make sure that the current context remained serialized with the background job data, and gets correctly restored when the job is started. It’s easy to achieve this with ActiveJob:
    class ApplicationJob < ActiveJob::Base
  def serialize
    super.merge({ logger_context: Current.context_for_logger })
  end

  def deserialize(job_data)
    super
    Current.restore_from_logger_context(job_data.with_indifferent_access[:logger_context])
  end
end
If you want to replicate this, there’s one more note about the ActiveSupport::CurrentAttributes worth making. While it's thread-safe and it resets between the requests, we noticed that it does NOT reset between the test examples, so we also had to add Current.reset in our spec_helper.rb to run before each example.
    RSpec.configure do |config|
  config.before do |example|
    Current.reset
  end
end
Exposing the metadata
With Current, we only saved the information about the user and request but we're not actually displaying that anywhere yet. We need it to be handled by the logger, ideally without any effort from the developers. We needed support for outputting logs in JSON as well as in raw format, so that the logging on the local machine remained compact. ougai provides support for that in the Ruby world, and although it's not a “highly starred” project, it's complete and useful.
In our shared library, we've added a common logger to be used across our applications:
    require "ougai"
require "active_support"

module GatUtils
  class Logger < Ougai::Logger
    include ActiveSupport::LoggerThreadSafeLevel
    include ActiveSupport::LoggerSilence

    attr_accessor :current_context

    def initialize(*args, **kwargs)
      @current_context = kwargs[:current_context]
      @logger_format = kwargs[:logger_format]
      super(*args, **kwargs.except(:current_context, :logger_format))
    end

    def create_formatter
      if @logger_format == :json
        formatter = Ougai::Formatters::Bunyan.new
        formatter.datetime_format = "%Y-%m-%dT%H:%M:%S.%NZ"
        formatter
      else
        Ougai::Formatters::Readable.new
      end
    end

    def log_additional_context!
      @before_log = lambda do |data|
        data.merge!(current_context.context_for_logger)
      end
    end
  end
end
Let's dig in on what it does exactly.
Firstly, in order to ensure that the logger behaves properly with rails, it’s important to include ActiveSupport::LoggerThreadSafeLevel and ActiveSupport::LoggerSilence.
Next, in the initialization, we want to have an option to pass our current context and define the format being used by the logger. The rest of the arguments should be passed to the original initializer.
Then we have overriden create_formatter from Ougai::Logger to return a formatter configured during initialization. For JSON formatting, we are using Ougai::Formatters::Bunyan ; and for plain text Ougai::Formatters:Readable.
Finally, we can turn on logging additional context using before_log callback provided by ougai. We found that it's a good option to turn it on in the production environment, but to keep it optional for the local environment as it can be very verbose.
Now, the remaining step is to add the above logger to our application. In our config/application.rb we can add:
    logger = ::GatUtils::Logger.new $stdout, current_context: Current
config.logger = logger
config.active_job.logger = logger

Sidekiq.configure_server do |config|
  config.logger = logger
end
At this stage, we still haven't enabled additional context logging, so let's do that in our config/production.rb:
config.logger.log_additional_context!
And that's it! You don't have to modify any calls to your logger, it should work out of the box. (If you are using tagged logging there's additional work to be done, but you can follow ougai documentation). Now our application on production is producing JSON logs!
So to spell out how it works, here’s an example of a notification on Sentry about an ugly bug creeping in:

Then, in the environment section we can find the request ID that caused that error:

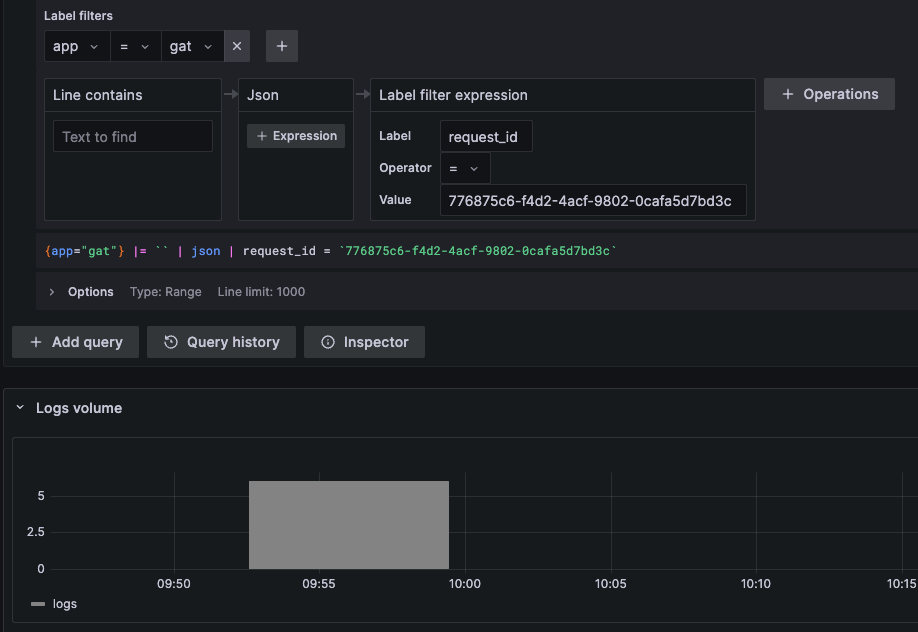
And navigating into our favorite Log browser, we can search for all the log lines from that request:

And therefore find what specific user was using this application and caused this error:
![]()
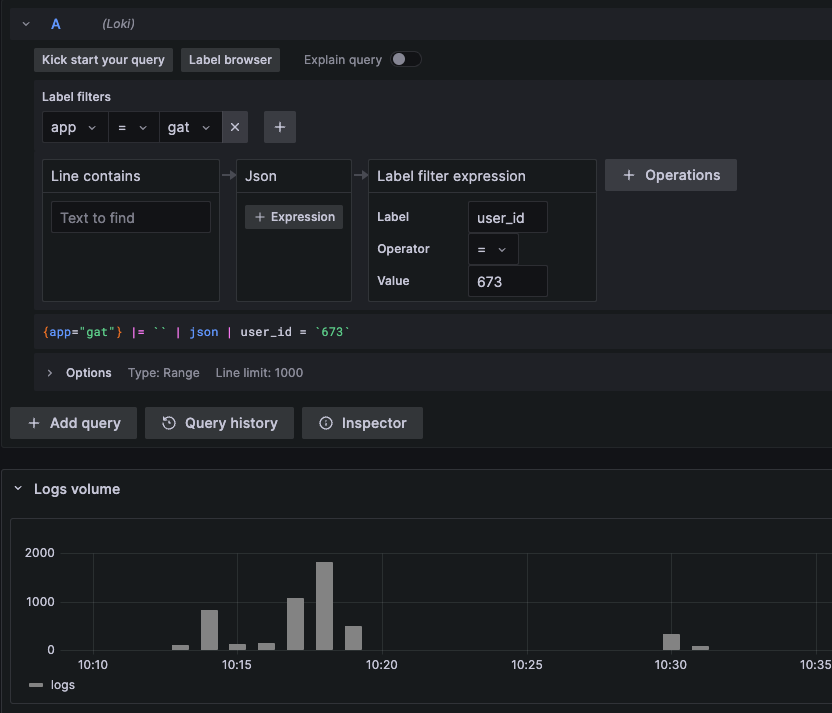
Next, if we want we can check their whole activity to detect what might have lead to the issue, we can examine that, too:

Additionally, locally when we debug something we can pass the additional data to the logger as well, by passing optional hash:
Rails.logger.debug("Payment status", user_id: payment.user_id, payment_status: payment.status amount: payment.amount)
It will be nicely displayed to us in your console, easily visible among the other lines of logs:
You can of course add more data to the logs specific to your application and needs that should make debugging your users problems a breeze... or at least a bit easier!

